
Integral Part of Solar Panels: The Power Optimizers

Introduction
To begin with, the dystopian danger of fossil fuel’s depletion has started to become a real threat in day to-day life. To mitigate this threat, industries from all over the world are moving towards more sustainable energy sources and from all those energy options PV and wind are the most prominent ones in the global market. But for the context of this article, lets focus on the PV energy systems and moreover on the power optimization of PV array system. PV energy has a potential to become a major source of energy generation in the distant future since it has several positive attributes such as low maintenance cost, free and unlimited amount of energy, robust and long-life components. Even though PV energy is the cleanest form of energy but still it has a considerably low output power efficiency of around 25% (commercially used solar panels). In addition to that, sometimes energy generated by the PV arrays does not match the load demand, as the output energy of PV panel is dependent upon the various factors stated below:
- Unpredictable Nature
- Weather and climate change
- Solar energy available at the site
- Geographical location of the site
- Ambient temperature
- Clearness index
- Tilt and orientation of PV panel
To tackle these above problems there are several options that can be included and calculated while designing the PV panel:
- Maximum Power Point Tracking (MPPT)
- Peak efficiency
- Euro efficiency
- Array optimizers/maximizers
- Input voltage range
- Wiring
Maximum Power Point Tracking (MPPT)
Maximum power point tracking is a technique of tracking the operating point of PV system and extracting the maximum power output at any given working condition. MPP tracker is never an actual separate component itself but it always comes with a DC-DC converter in a PV inverter system. However, it is a very important integral part of the power optimization process.
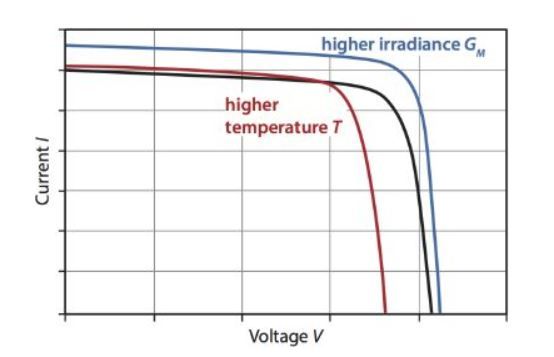
The behaviour of PV cell can be illustrated by the characteristic curve of I-V relation. The module temperature and solar irradiance are the two most important factors on which the IV curve changes.
Now let’s focus on the operating point, which can be termed as the voltage and current at which the PV module operates at any given point in time.
For a given irradiance and temperature, the output power at this operating point is given by:
P = I * V
When the operating point IV curve matches to the point on the maximum power-voltage (P-V) curve then it is called as the Maximum power point (MPP).
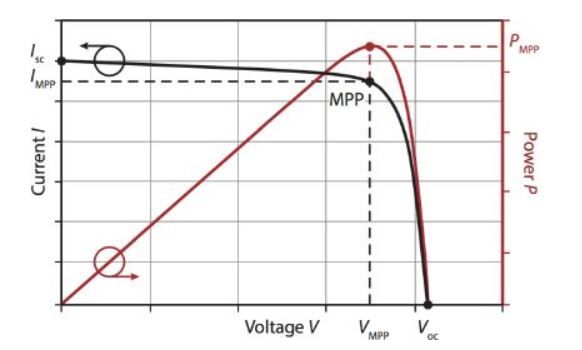
In case of electrical load, the operating point of PV array is directly proportional to the electrical load. Hence in this case to make the module to work at MPP is to force the voltage of the PV module to be at MPP point i.e. also known as otherwise the MPP is dependent upon the external factors such as temperature and irradiance i.e. if these factors change, the P-V and I-V curve also changes a bit. Therefore, these changes need to be continuously tracked so that the operating point can be moved to achieve the maximum power at any given external condition. Hence, this tracking process is called as Maximum Power Point Tracking (MPPT), with the help of MPP Trackers.
There are two types of MPP Trackers:
- Indirect MPPT
- Direct MPPT
1] Indirect MPPT: Indirect MPPT is simple method consisting few measurement steps. There are mainly 2 methods namely Fixed voltage method and Fractional open circuit voltage method.
a) Fixed voltage method: In the fixed voltage method, the operating voltage of PV array is adjusted based on season change. In this method, MPP voltage are kept constant throughout the year. Also, this method works best where, there is a very low deviation in the irradiance throughout the different days of the year. Hence this method is not very accurate for every geographical site location.
b) Fractional open circuit voltage method: This is the most common indirect MPPT technique, used in practice. In this the value of
is given by,
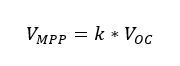
Where, k = constant (for crystalline silicon, the value comes between 0.7<k>0.8.
The open circuit voltage of any system can be easily carried out, therefore, changes in can be easily calculated by just multiplying with the constant k. Hence, this method is very easy to implement.
But on the other hand, there are few drawbacks. Firstly, as we are using constant factor k, it gives us a rough approximation of the MPP. So, its hard to get the MPP to the exact point as it will hover around its proximity. Secondly, each time when the system must respond according to the irradiance, for that must be measured and for this the PV modules needs to be disconnected from the load (for really short period of time). But this will ultimately result in the reduction of output power. Which also directly affects the overall efficiency of the system.
But the good news is that this drawback can be easily overcome by adding a pilot PV module to the existing system. This pilot PV will have the same specification and will get same irradiance as rest of the modules. So now, the of the system is measured on this pilot PV module and can get estimated. Therefore, without even disconnecting the whole system from the load, the operating point can get adjusted to the MPP.
2] Direct MPPT: Direct MPPT is more involved as compared to indirect MPPT as it requires measurements of current, voltage and power. Also, Direct MPPT is more accurate in terms of output, in comparison with Indirect MPPT. There are two major algorithms used for measurement, which are as follows:
- Perturb and Observe (P&O) algorithm
- Incremental conductance algorithm
a) Perturb and Observe (P&O) algorithm: This method is also known as “The hill climbing algorithm”. In this method, a deviation is provided to the operating voltage of the system, it leads to change in output power. By this logic, if voltage increases, the output power also increases. But for the operating point to reach at MPP, further perturbation towards higher voltage is required. In contrast, if an increasing voltage leads to a decreasing output power, then in this case further perturbation towards lower voltage is required in order to reach the MPP. The summary of possible options of P&O algorithm is given below.
There are two small problems with this algorithm. First is that the operating point is never steady state at the MPP but is always hovering around it and secondly P&O algorithm struggles when there are rapid fluctuations in the irradiance. The summary of possible options in P&O algorithm is given in below table.
| Prior Perturbation | Change in Power | Next Perturbation |
| Positive | Positive | Positive |
| Positive | Negative | Negative |
| Negative | Positive | Negative |
| Negative | Negative | Positive |
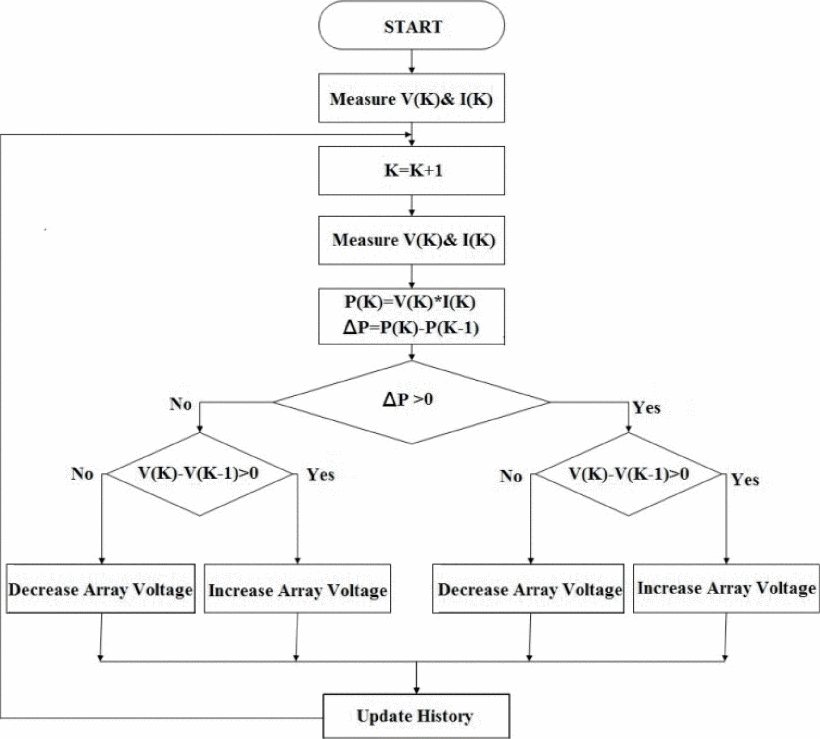
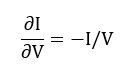
b) Incremental conductance algorithm: In incremental conductance system the array terminal voltage is often modified based on the incremental and instantaneous conductance of the PV module according to the MPP voltage.
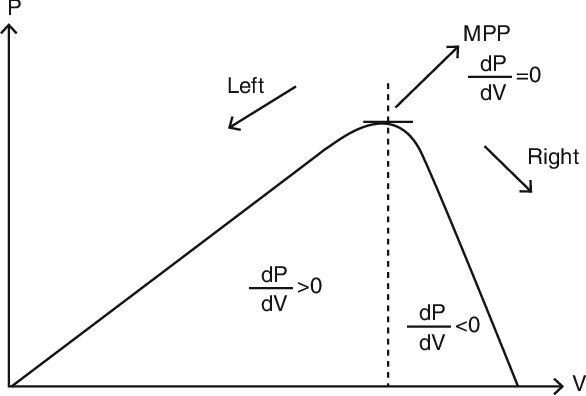
That the P-V array power curve slope is zero at the MPP, rising to the left of the MPP and falling to the right of the MPP. The basic equations are as follows.
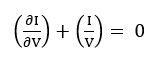
Where I and V are the output current and voltage of the PV array, respectively. The left-hand side of equations represents incremental P-V module conductance and the right-hand side represents the instant conductance. The solar array will operate at the maximum power point when the ratio of change in output conductance is equal to the negative output conductance.
This approach exploits the principle that the ratio of shift in output conductance is equal to that of instantaneous conductance of negative output. We got,
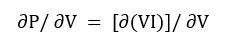
P = VI
Applying the chain rule for the derivative of products results into,
At MPP,

The above equation can be rewritten in terms of array voltage V and current I,
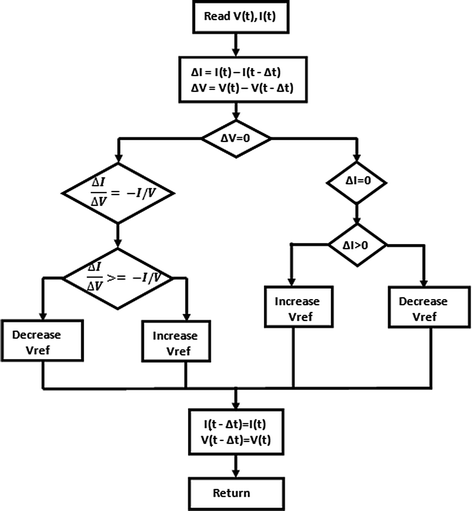
The MPPT controls the dc-to – dc boost converter’s PWM control signal until the condition is satisfied.

In this process the module’s peak power lies above 98% of its incremental conduct. The Incremental Conductance MPPT Flow Chart is shown below.
Inverter Efficiency
In terms of solar inverters, efficiency is a proportion of the conversion of DC electricity from solar panels to AC electricity and Mainly there are two types of efficiencies that should be taken into the consideration.
- Peak efficiency
- Euro efficiency
1] Peak efficiency:
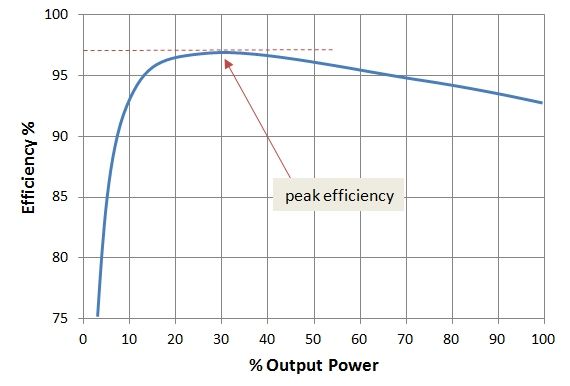
That measures your inverter ‘s efficiency at one point – when it performs at its best. In simple words, when the inverter operates at (normally) its rated capacity, peak efficiency is calculated as DC input to AC output. While this is a remarkable figure, inverter efficiency isn’t the final word. Just for a very limited proportion of the day – or not at all – the inverter will work within its peak efficiency range. Efficiency for an inverter varies according to the input power of your solar panel array.
2] Euro efficiency: These forms of output are efficiencies which are weighted. They are more useful than peak efficiency estimates, as they calculate inverter output across the power spectrum of the inverter. This gives you a better idea over the course of the day regarding the operating profile of the inverter. Besides, the meaning of weighted efficiency is rather than just looking at how the inverter operates at its ‘ideal range’ power input, measuring weighted efficiency first involves choosing a few DC input levels compared to the rated capacity of the inverter. For the efficiency of Euro and CEC (California Energy Commission), the calculation has six efficiency points.
On the other hand, the coefficients ‘weigh’ the value of each level ‘s efficiency, based on estimates about how much the inverter would function at each level. The distinction between weighted efficiency Euro and CEC lies in how they distribute their weights to achieve an acceptable efficiency.
California Energy Commission (CEC) weighted efficiency

Euro weighted efficiency

From the above example, it can be seen that both CEC and Euro weigh the performance of an inverter at a capacity of 30 per cent with a coefficient of around 0.10. The Euro model, on the other hand, requires a 50 per cent measure but not 75 per cent measure and CEC vice versa. Another is not inherently better than the other, but the buyer should be aware that for the same inverter, such variations will result in different efficiency numbers.
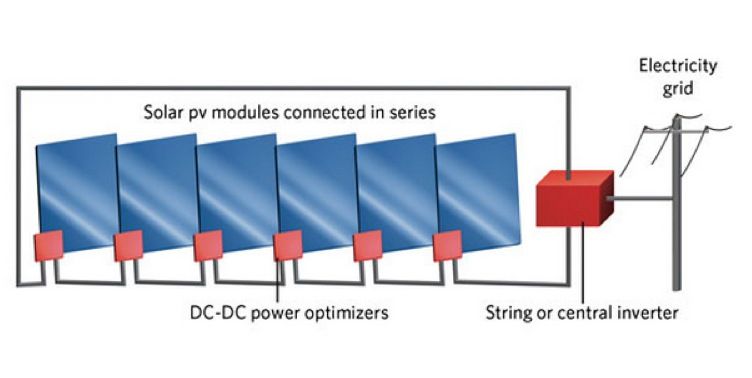
Array power optimizers

In many industrial applications the DC-DC converters with high voltage ratio are required. Conventional boost converters, except for an intense duty cycle, can’t have such a high DC voltage gain. A traditional system for generating PV is either a single- or multi-string PV array connected to one or more central PV inverters. For individual PV panels the use of an AC module or micro inverter was proposed earlier. Although this discrete solution for generating PV power can partially eliminate the shadow problem, a micro inverter structure restricts the conversion efficiency of the device energy and induces high costs. A solar power optimizer is a DC-DC converter that is used to maximize the energy collected from photovoltaic solar systems. Solar modules are connected in an array in series; to generate optimum power when all modules are performing well. As temperature increases, or leaves, snow or shadow partially cover modules, the output decreases, modules heat up, and drag down the other modules’ efficiency. This causes power loss in the series. In raising the downside, power optimizers can be used. Power optimizers are DC-DC converters which are individually connected to the board. Maximum output is drawn from the modules, allowing each module to operate at its maximum point of power (MPP). It causes the whole array to generate more electricity. Power optimizers for solar applications may be similar to micro inverters, in the sense that both devices aim to isolate individual panels to boost overall efficiency of the system. A solar panel or solar cell incorporated power optimiser to shape a smart package. In a single case, a micro inverter basically incorporates a power optimizer with a small inverter that is used on each row, whereas a centralized inverter is used for the power optimizer for the entire array. Using this hybrid approach has the advantage of lower overall system cost and reduced electronics.
Input voltage range
It is important to consider that providing many parameters for the Power Inverter is very difficult. As a matter of fact, knowing the “valued input voltage” parameter is once and for all in photovoltaic device design. It’s able to follow certain technological requirements automatically.
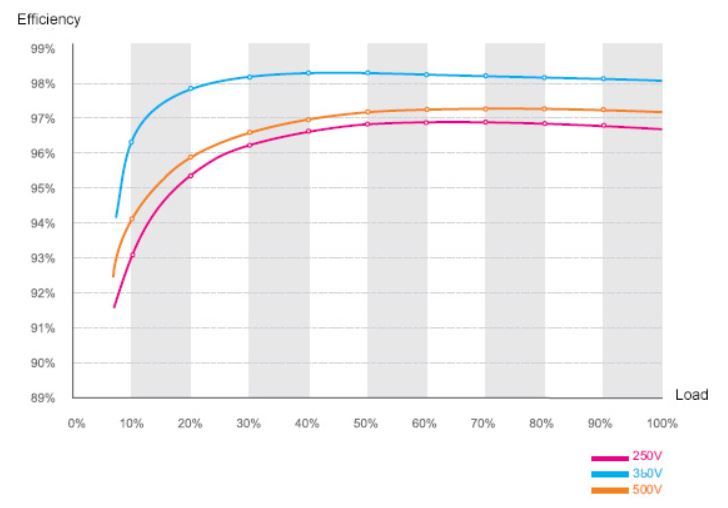
This figure has 3 lines, reflecting grid connection inverter efficiency when three forms of input voltages are present. It is clear that different voltages have different effectiveness. Between them, the blue line 360V has the highest performance, followed by red line 500V and the lowest performance is the purple line 250V. This conveys the message that if the string voltage is built around the rated voltage, the inverter ‘s efficiency will be very high, and the capacity to produce power will be high. The explanation for this begins with the Power Inverter principle. For the string inverter’s DC-DC-Boost circuit, the DC voltage must be boosted and balanced to some value (this is called the DC bus voltage) before it can be converted to AC power. As for the 230V production, it will have a DC bus voltage of about 360V. The DC bus voltage should be around 600V as for the 400V output. As for the 500V output, it should have a DC bus voltage of around 750V. As for the 540V production, it will have a DC bus voltage of about 800V. Nevertheless, the connected voltage of the part series is usually not that high, and the circuit must be modified. Generally, the grid tie inverter is balanced by PWM. There is a term called duty ratio, equal to the voltage / DC bus voltage component series. The duty ratio is closely linked to productivity. A higher duty ratio tends to produce smaller difference in voltage and greater efficiency. Complex equations need not be determined by the power inverter part. Simply try to adjust the string voltage to the inverter ‘s measured operating voltage, you’ll have the highest output even at the extreme low temperature, the maximum voltage will not be exceeded. Throughout operation, it will also be within the range of full load MPPT voltage which is completely easy and practical.
Conclusion
In conclusion, even if the output power efficiency of the PV array could get affected by the many surrounding factors but even though, the PV system can still achieve an achieve its maximum output efficiency by
- Keeping the operating point inside the MPP area by using Tracker.
- Determining the correct size and output of the connected inverter by calculating its Peak and Euro efficiency.
- Using array power optimizers for enhancing the output of inverters and overall PV system.
- Determining the exact input voltage range to achieve maximum output efficiency.